Teaching fractions and ratio through bar models
Sunday, 6 Mar 2022According to the NCETM, “the bar model is used in teaching for mastery to help children to 'see' mathematical structure. It is not a method for solving problems, but a way of revealing the mathematical structure within a problem and gaining insight and clarity to help solve it” (NCETM, 2015). The bar model has been gaining traction for a number of years, especially in primary schools, but I have previously been resistant to it. There have been various things which had dissuaded me, for example where advocates of bar modelling had demonstrated hopelessly convoluted uses of bar models when a much more sensible algebraic approach existed, or to a lesser extent, my (as yet unresolved) issue with having negative lengths. However, having seen the potential of bar models for teaching ratio and proportion, I decided to teach a series of lessons using bar models on fractions, finding fractions of amounts and sharing in a given ratio to my middle-attaining year 8 class over the course of three weeks. About a month after this series of lessons, I interviewed three pairs of students who had attended the lessons. During the interviews, I asked them to complete five questions (below) and then asked them to reflect on the approach they had used. I did not require them to use a bar model (and indeed not all of them did) but I did prompt two students with the question “could you draw a bar model?” if they were struggling to get started.
The questions discussed during the interviews:
- Find \(\frac{3}{5}\) of 40.
- \(\frac{n}{5}\) of 45 = 36. Find
 .
. - Albert and Bella share 20 sweets in the ratio 3:2. What can you work out?
- Charlie and Delia share some sweets in the ratio 5:3. Delia gets 12 sweets. What can you work out?
- Eve and Fred’s ages can be expressed as the ratio 3:5. Fred is 6 years older than Eve. What can you work out?
One of the difficulties of using a bar model to represent a mathematical problem is making explicit the relationship between the bar model and the underlying mathematics. Making this relationship explicit requires careful consideration of the language to be used, both by me and by students in the class. I started by revisiting representations of fractions, specifically in bar form, with a full bar representing the whole. I chose to use the word bar to refer to the whole, and referred to the parts of the bar as sections. I did consider using only the more abstract part and whole but found that it was useful to have a way of discussing the mechanics of drawing and manipulating a bar.


Figure 1: an overview of the language of the bar
After the work representing fractions, we moved onto fractions of amounts. At this point, I emphasised the fact that a whole does not necessarily mean you have one of something. For example, in figure 2, a whole is equivalent 15 and so \(1\frac{2}{3}\) of the whole is equivalent to 25. This distinction was also important in the work on ratio where, for example, if something is shared in the ratio \(a:b\), \(a\) and \(b\) are parts and \(a+b\) represents the whole.
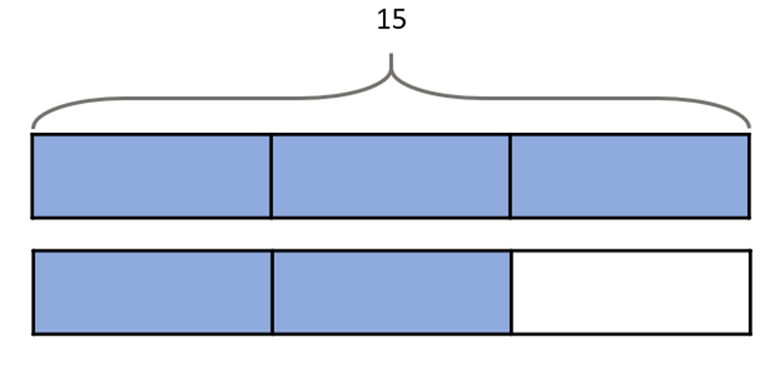
Figure 2: a bar model showing \(1\frac{2}{3}\)
One advantage of using a bar model which was identified by students is the fact that it is a convenient way of laying out your work. One student made the point that “you could do it another way but the bar helps you keep track of what bit you’re on – it’s all there in one place”. It is the perennial battle of maths teachers to persuade students that writing things down is helpful. Fortunately, however, students seem to be more willing to write things down on a bar model than they would usually be. Looking through exercise books, it was relatively common to see students drawing a bar model for each question, even though the strategy for the question was the same (as below).
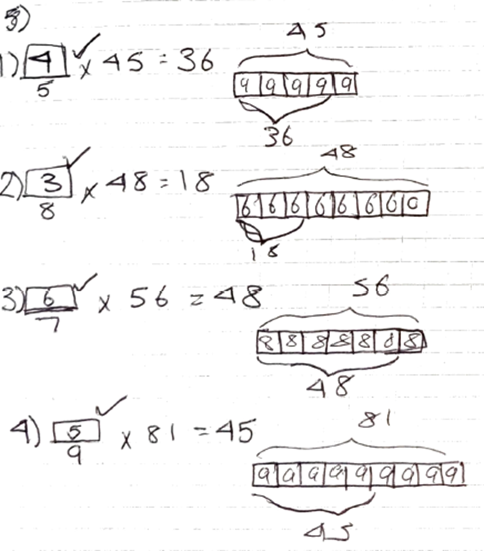
Figure 3: an example of a student using a bar model repeatedly
Another student made the point that “otherwise you have to keep everything in your head and that can be quite confusing”. We know that people on average can hold around 4 chunks of information in their working memory at one time (Cowan, 2001) so encouraging students to use strategies which reduce the burden on their working memory seems sensible, especially when some students seem to notice this advantage of bar models themselves. The students I spoke to tended to use bar models to record their thinking throughout the process of answering the question as can be seen below. It’s clear from the image (and was corroborated by follow up questions) that this student has continually referred back to the model. First the student notes the fact that the question is working with fifths, drawing a bar with 5 sections and then labelling them \(\frac{1}{5}\). Next the student calculates the value of one of the sections and labels each section accordingly. The student then counts up in nines (shading with a little squiggle as she goes) until she reaches 36. Having done the shading during this process, there is no difficulty in remembering how many nines she has reached and she can immediately see that \(n=4\). This is by no means a straightforward question: the question must be translated into at least two calculations; those calculations must then be performed; and the results of those calculations interpreted to produce an answer to the original question. The use of the bar model has reduced the load on the working memory allowing this student to effectively answer the question where, based on my experience of similar students in similar groups, I wouldn’t necessarily have expected a complete answer.
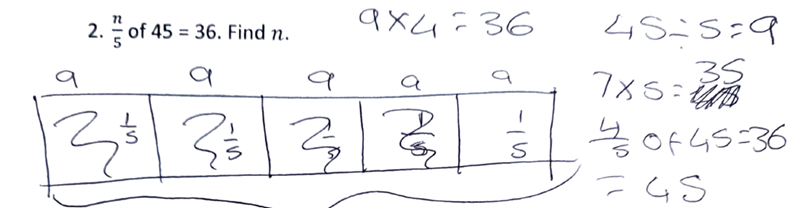
Figure 4: an illustration of the ongoing use of a bar model.
Whilst helping students keep track of their workings is a definite advantage of using bar models, I think the real power comes from the way it supports students to make sense of difficult, non-routine problems and translate them into a method for solving the problem. This advantage was more obvious for the more complicated, later questions. For example, when asked how she knew to divide by 5 on question 1, one student replied “because it’s three fifths” whereas in discussions of later questions she began to refer to the “8 sections” of the bar rather than referring directly to the fractions or ratios involved. Half of the students chose not to use a bar model for the early questions because they could see how to answer the question without doing so. For the later questions, students generally found the bar model helpful, with one student stating that “I’d probably have struggled to do it without it”. This point was also made by another student who said “if I didn’t have the bar, I would have been so confused. I wouldn’t have known where to start.” Often with more complicated problems, students don’t know where to start so they simply don’t. Encouraging the use of bar modelling means students always have a place to start. Moreover, their starting point does not require a full understanding of the question so they can start without having to have a fully formed idea of the path to a solution.
In addition, the bar model gives them something which they can use to monitor the progress of their solution: does what I have done fit with the bar model I have drawn? One student illustrated this point by getting an initially incorrect solution to question 2 which he was then able to correct because the bar model made it clear that it couldn’t be correct (an answer of \(n=6\) which would have been greater than 45). Another student explained that “I did something at first but then I changed it but the bar helped me realise I was right”. Reflecting on the progress of a solution is something which students often find challenging but it seems that the use of a bar model can support students with both of these aspects of problem solving.
One final advantage of the bar model in making sense of problems is the fact that students can visualise the question. This point was made by four of the students I spoke to, who made comments about how visualising it helped them. When describing how they answered questions they made comments like “I could see how see how many” or “I could see Delia’s part of the ratio was 3”. The student’s work below illustrates the way students were able to see the key information from the question on the bar model they had drawn. The student below has drawn a line indicating Eve’s three parts, and then sectioned off three of Fred’s parts before labelling the extra two parts which Fred has. The visual nature of the bar model has clearly supported this student to make some correct deductions on what would be, at least with more traditional methods, a very challenging question.
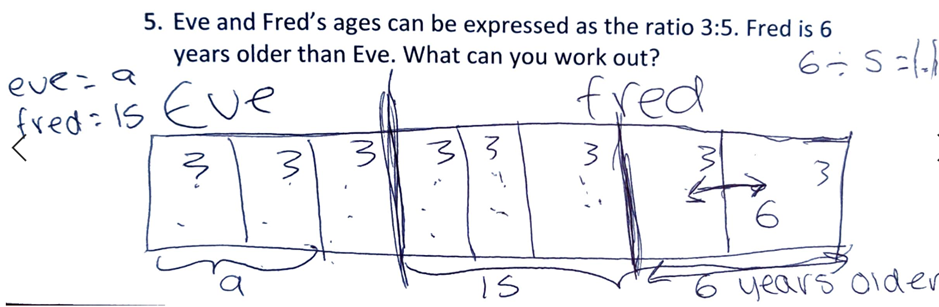
Figure 5: visualising the important information from the question
As an aside, a number of colleagues and I debated about whether to draw ratio bar models as lines or as stacked bars. The advantage of stacked bars is that it makes questions like “how much more does Fred have than Eve” significantly easier whilst placing the bars in a line enables parallels with finding fractions of amounts to be drawn more easily as the bar model which is drawn is the same in both cases. We settled on drawing the bar models in a line which, as can be seen from figure 3, doesn’t seem to have impacted their usefulness for questions like this.
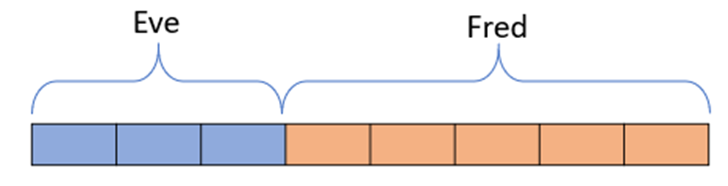
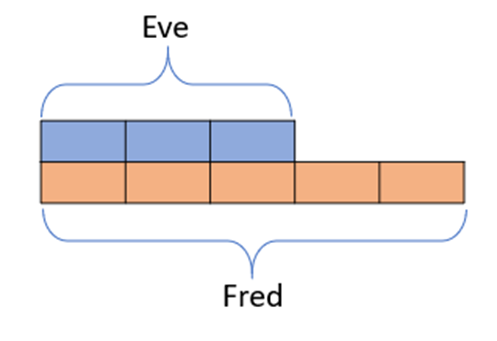
Figure 6: stacked bar models vs lines
When introducing a support for students within a particular topic, a question in the back of one’s mind must always be “how will we help students to move away from relying on this support once it has served its purpose?”. One slight concern which has arisen as a result of using bar models is that students tended to count on rather than multiply after finding the value of one unit, perhaps because of the way the bar gives you something you can count. This was illustrated by a student who, having found out that one fifth was worth nine, said he “wrote out the nine times table until I got to 36” whilst another repeatedly added on the unit value rather than multiplying to get the desired number of units. This could potentially cause confusion if there was a question which required them to find, for example, \(2\frac{1}{2}\) parts (although I think fractional parts may in itself present some difficulty in bar modelling). However, in general, I think the bar model was used as a way of making sense of the question, rather than as a method in itself. Students tended to describe the process they were carrying out (for example “I divided by 8” or “I worked out how many 9s go into 45”) rather than referring to the bar itself. The bar informed the method rather than being the method. As the questions became more complex, the references to the bar itself did increase (“I drew a box with eight sections”) but generally this was alongside a reference to a calculation (“so I multiplied eight by four”). Encouragingly, there was also at least one student who had initially used the bar model but no longer did so, having made sense of the sorts of questions we had been working on. He said that “when we first started doing this topic, I was using the bar model. It was definitely helpful at first.” This is exactly how I would like students to make use of bar models: use them when they’re helpful and then have the confidence in their understanding of the underlying structure to move onto more concise ways of recording their work once they are no longer useful.
The students I spoke to were unanimous in saying that they found the bar models useful. I found that they were hugely powerful in supporting students to interpret questions and then generate a method which they could work through, as well as giving them an accessible way into solving more complicated problems. Getting started can be the most difficult part for some students and bar models allow all students to make a productive start. They also allowed students a way to record what they were doing, making some questions more manageable than they would otherwise be. Furthermore, the connection between ratio and proportion is made much clearer than through more traditional ways of teaching these topics. The link between questions like “share £10 in the ratio 3:7” and “find \(\frac{3}{10}\) of £10” is made much more explicit. I also felt that my explanations were much clearer and that my efforts to help students understand why we were doing each step was much less reliant on verbal explanations than it has been previously, and indeed has been when teaching other topics. Often persuading students to write supporting calculations can be a challenge but bar models afforded them a clear and relatively concise way of recording their working.
Overall, I am very much persuaded that bar models are an excellent way of helping students make sense of ratio and proportion. The connections between topics that they emphasise is hugely beneficial for students, as well as the way they reveal the underlying structure of a problem, and I look forward to seeing how I can expand their use in other areas.
James Baker, Joint Head of Maths at Comberton Village College, Cambridgeshire
This article was first published by the Association of Teachers of Mathematics in MT280 on 8 February 2022
NCETM, 2015, The Bar Model, viewed 14 June 2021, <https://www.ncetm.org.uk/classroom-resources/ca-the-bar-model/>
Cowan, N 2001, The magical number 4 in short-term memory: A reconsideration of mental storage capacity, Behavioural and Brain Sciences, vol. 24, no. 1, pp. 87-114.